Back to Home Page

zengo

Collaborative App Optimizing the Public Transport Experience with Personalized Routes and Real-Time Alerts

Project overview

Project overview

My role in this project was to design an innovative experience to improve urban mobility in the post-COVID context, taking into account new behaviors and social challenges related to public transportation. The goal was to create a collaborative solution enabling users to better anticipate and manage their journeys.

date

4 months

tools

Figma

Problem statement

Problem statement

❌ The health crisis changed mobility habits, making the public transport experience more stressful and unpredictable.

❌ Lack of real-time information about disruptions and service incidents.

❌ A need for a solution adapted to users' new post-pandemic behaviors.

Goal

Goal

👉 Design an intuitive and collaborative application to enhance the public transport experience by allowing users to report and anticipate disruptions.

👉 Integrate personalized features to reduce stress and make trip planning easier.
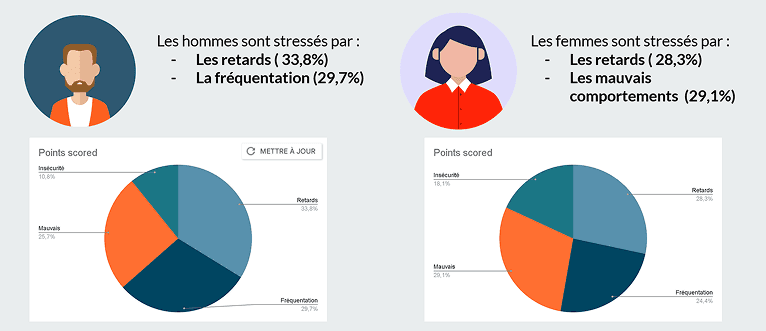
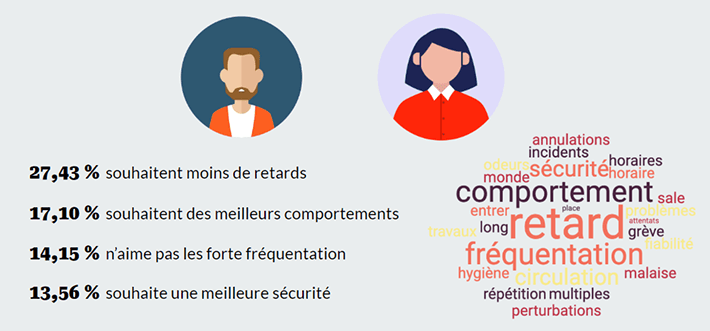
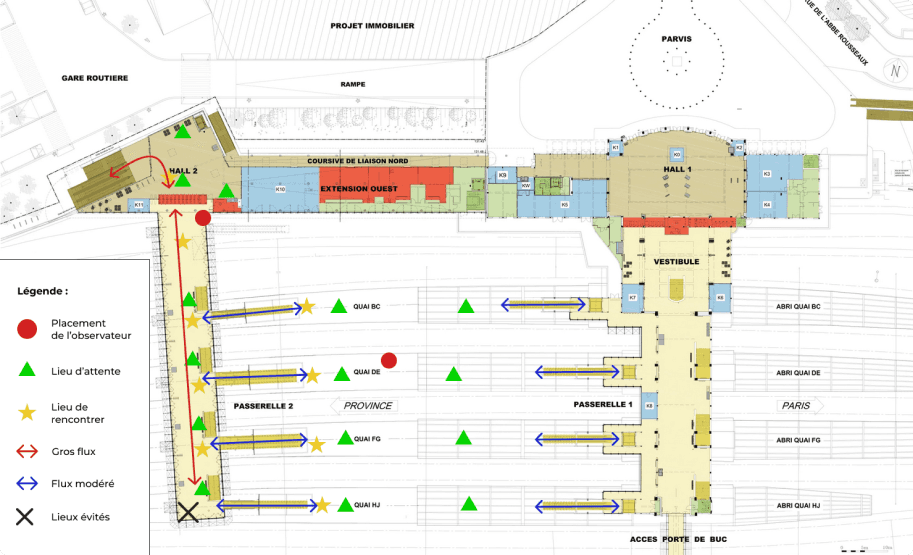
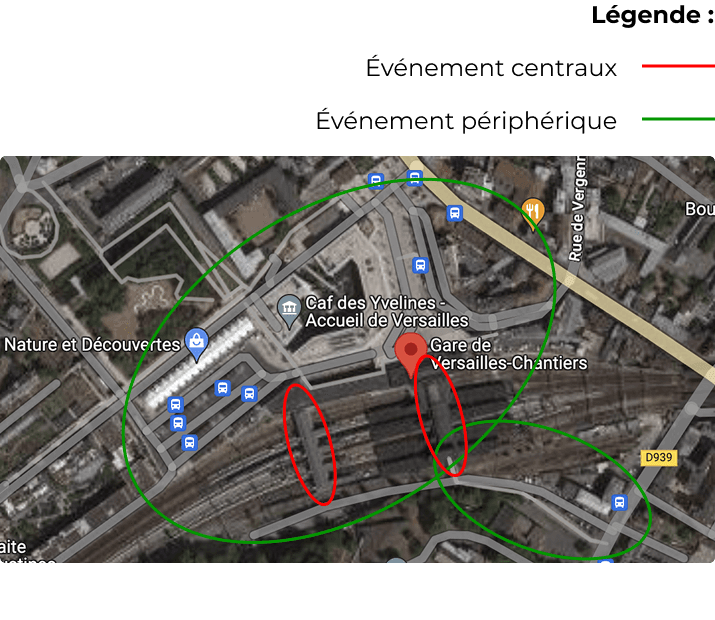
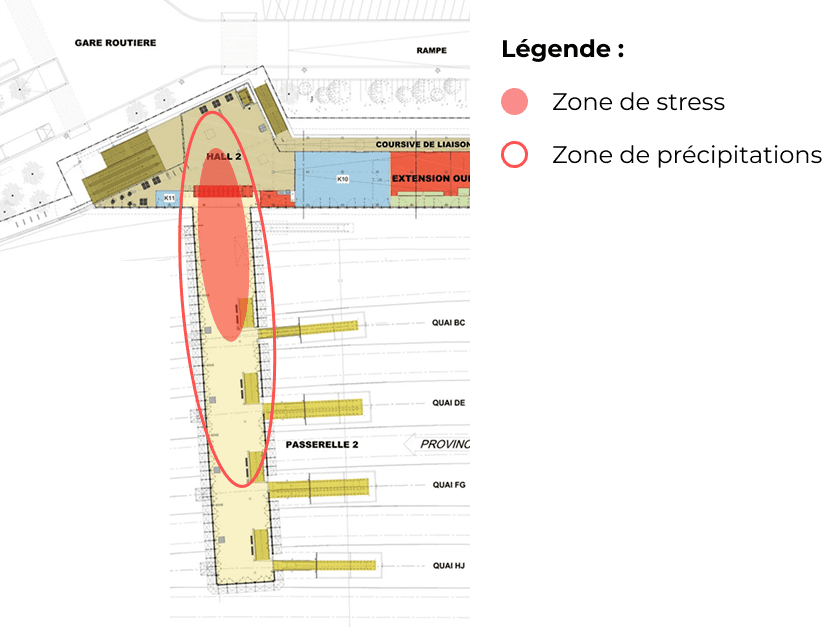
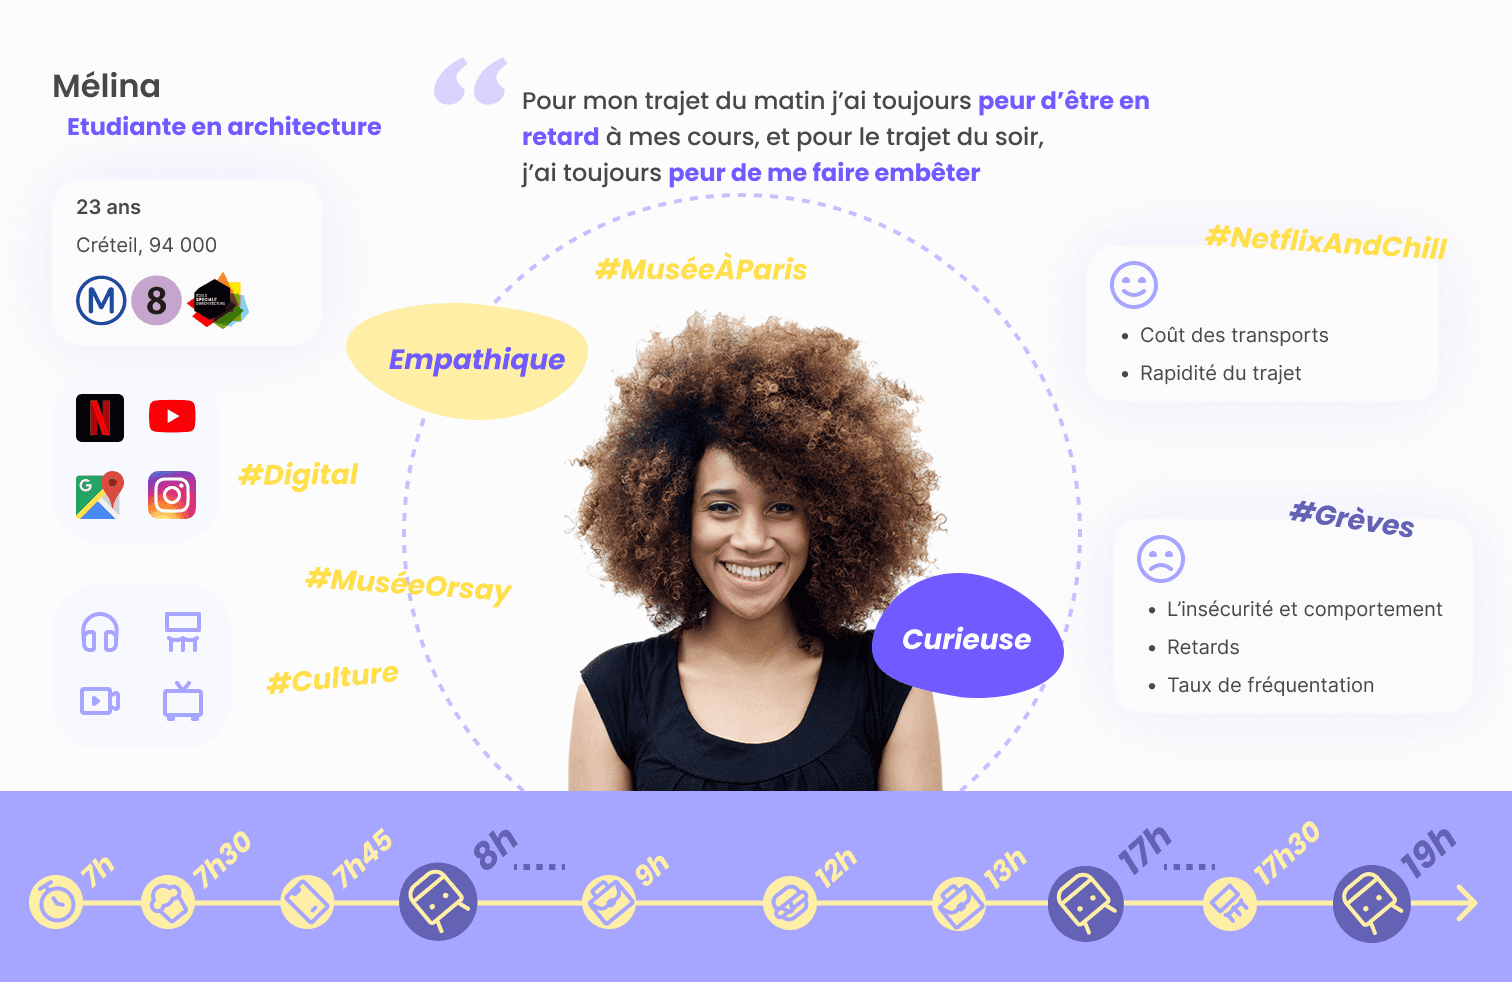
EMPATHIZE

EMPATHIZE

SURVEY

SURVEY

To guide our thinking and avoid overly generic questions, we developed a preliminary problem statement that served as a foundation for our questionnaire design:

How can we make the public transport experience more pleasant in a post-COVID context disrupted by social factors and new human behaviors?

Our goal was to improve the user experience of public transport by taking into account the changes brought about by the health crisis. This issue became obvious to us after observing common frustrations, which motivated us to learn more about users’ needs and expectations. Thanks to the questionnaire results, we were able to refine our thinking and develop a solid problem statement for our semester project.

Questionnaire Structure:

👉 Context: An introduction to explain the topic and our approach to respondents.

👉 User Profiles: Collecting participant data (age, transport usage frequency, etc.).

👉 Transport Usage: Dividing respondents into two groups:

  • Non-users: Understanding reasons for not using public transport.

  • Users: Exploring habits, frequency, and feelings about their journeys.

👉 Emotions and Behaviors: A deeper look into user stress levels, trust, and expectations.

We used three types of response formats:

✅ Closed questions (fixed choices for quantitative data)
✅ Open questions (to gather opinions and personal experiences)
✅ Semi-open questions (predefined choices with space for comments)

Implementation and Distribution:

The questionnaire took around six minutes to complete and included between 13 and 26 questions depending on the respondent’s profile. Once finalized, it was set up on Google Forms and distributed through a campaign to gather as many responses as possible.

👉 Distribution period: 1 week (from March 2 to March 9, 2023)

👉 Number of respondents: 124 people

Throughout this period, we shared the questionnaire across various channels to maximize visibility and ensure a diverse sample.

"I’m often stressed out by delays, but there’s no real-time information. I end up running everywhere not knowing if I’ll miss my connection."

-Béatrice

"I’m often stressed out by delays, but there’s no real-time information. I end up running everywhere not knowing if I’ll miss my connection."

-Béatrice

"I’m often stressed out by delays, but there’s no real-time information. I end up running everywhere not knowing if I’ll miss my connection."

-Béatrice

Field Survey

On Tuesday, April 11, 2023, between 8:10 and 8:40 AM, we conducted a field survey at Versailles Chantiers station, a key transit hub for many workers and students in the Île-de-France region. The goal of this observation study was to better understand user behaviors in both normal and disrupted situations.

Our Objectives:

We aimed to analyze several aspects of the user experience on public transportation:

🔹 The level of attention passengers pay to their route and next stop.
🔹 The tools used to access real-time travel information.
🔹 The use and effectiveness of navigation apps.
🔹 How users react to disruptions (delays, line changes).
🔹 Identifying typical user profiles for public transit.

Observation Process:

We conducted timed headcounts to measure station traffic:

👉 61 people in one minute during the first count
👉 77 people during the second
👉 51 people during the third

➡️ Average: 63 people per minute, estimating around 3,780 people per hour between 8 and 9 AM on weekdays.

Additionally, over 15 minutes, we observed that 7 people used the elevator, indicating that certain infrastructure remains essential for accessibility.

Observed Behaviors:

The survey revealed a highly dynamic environment, with varied behaviors:

⚡ Haste and stress: users running to catch their train, others looking confused in front of the display screens.
⏳ Average waiting time: 8 minutes (based on a sample of 10 people).
😐 Serious expressions: few interactions, everyone focused on their journey.
😟 Frustration due to delays: 2 delayed trains in 30 minutes, causing visible disappointment.

Findings and Conclusion:

Our study confirms that commuting in the Paris region via public transport is a major source of stress. The unpredictability of delays, overcrowding, and other disruptions weighs heavily on users, who lack reliable tools to anticipate these issues.

🎯 Design Decision Based on This Survey:

👉 Add a real-time crowding report feature, allowing users to adjust their routes and avoid overcrowded areas.

SOLUTION

SOLUTION

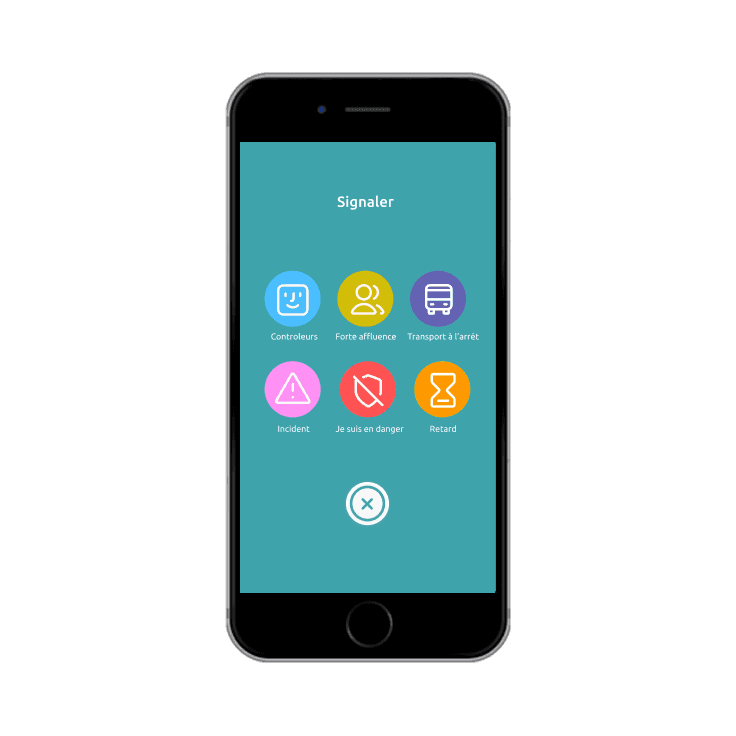
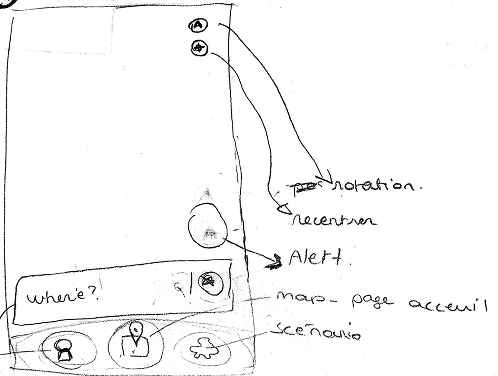
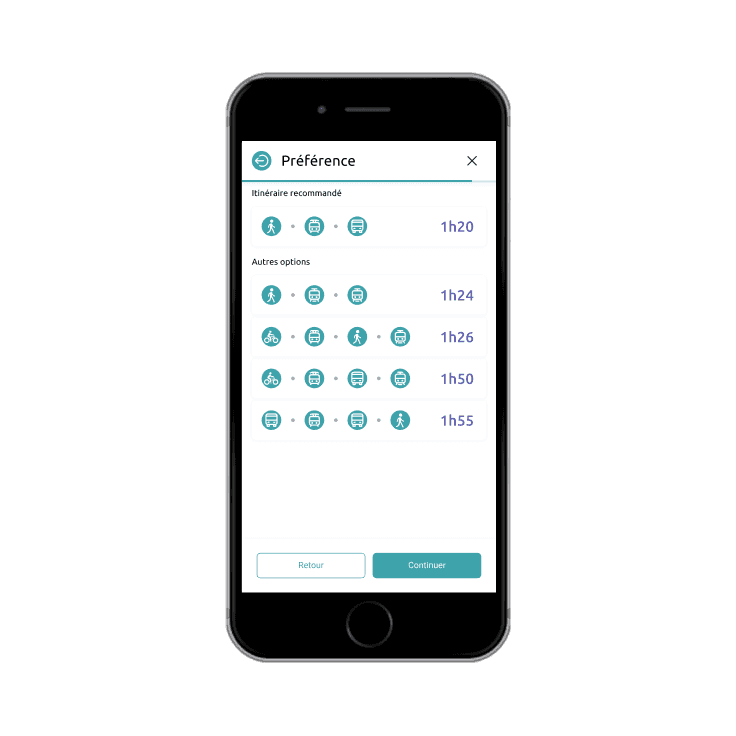
👉 The application allows users to report incidents on their lines in real-time and adjust their routes accordingly.

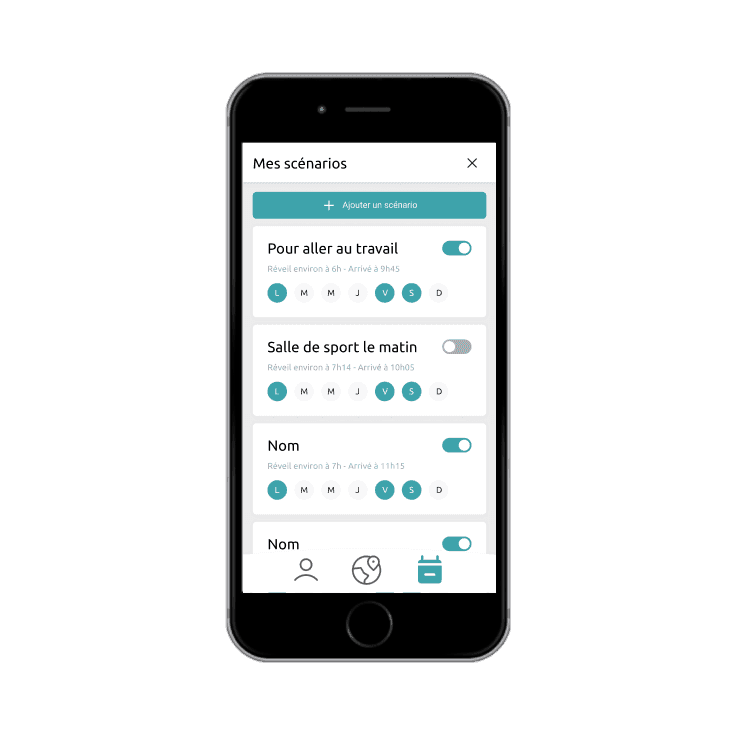
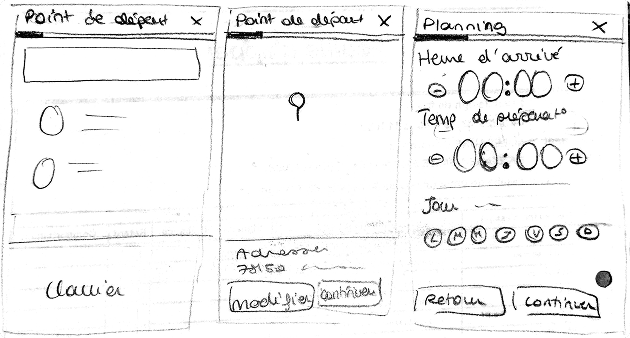
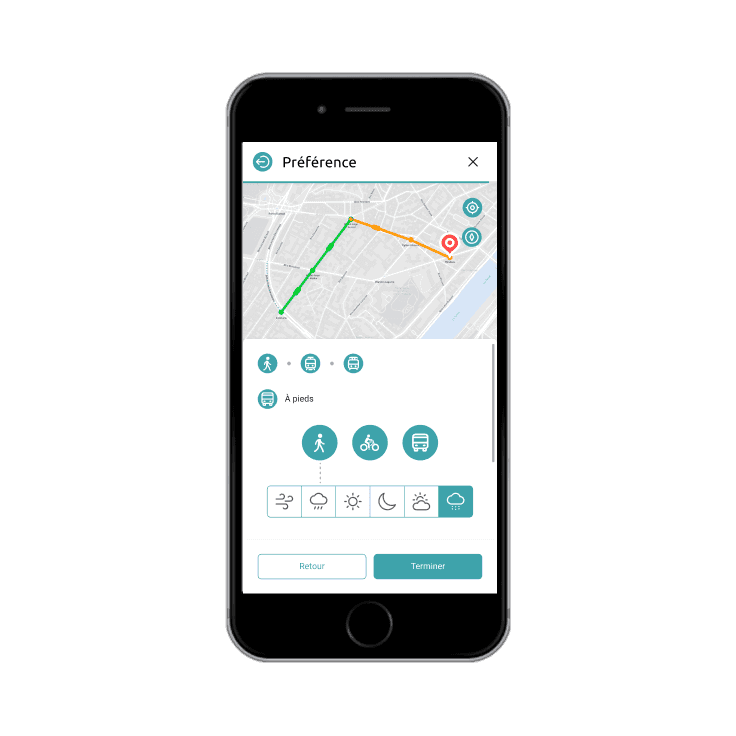
👉 The management of personalized scenarios enables each user to optimize their journey based on their personal criteria.

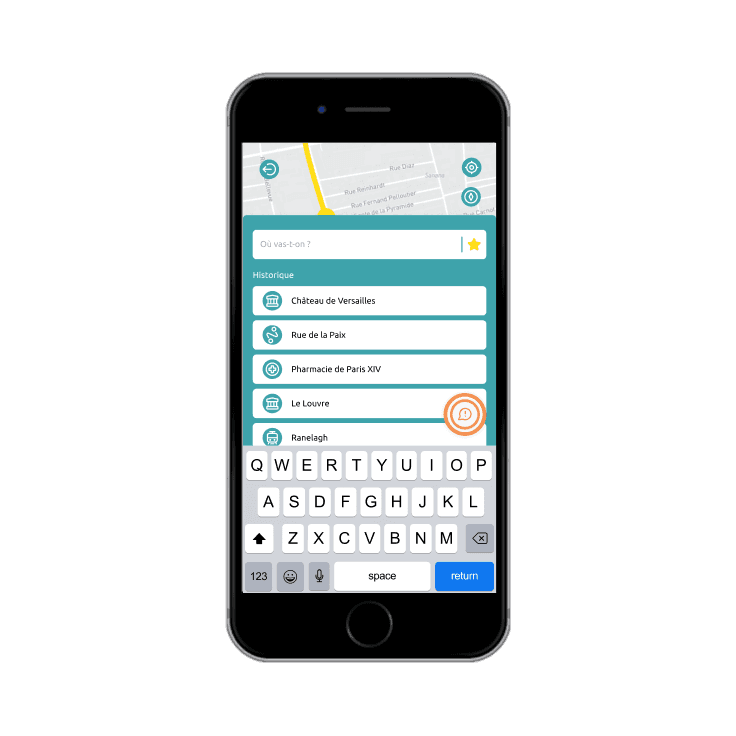
👉 The user experience has been reimagined to make journeys smoother and more predictable.

Define

Define

PERSONA

PERSONA

BENCHMARK

BENCHMARK

This step allowed us to identify best practices, weaknesses, and opportunities for improvement. We compared several similar products and services, focusing on ergonomics, features, user experience, and design.

FEATURE DOCUMENTATION

FEATURE DOCUMENTATION

View the documentation (.pdf)

Ideate

Ideate

sketching

sketching

"Since the pandemic, I’ve become more anxious about taking public transport, and I don’t have an easy solution to avoid crowds or long journeys."

-Clément

"Since the pandemic, I’ve become more anxious about taking public transport, and I don’t have an easy solution to avoid crowds or long journeys."

-Clément

"Since the pandemic, I’ve become more anxious about taking public transport, and I don’t have an easy solution to avoid crowds or long journeys."

-Clément

Design

Design

VISUAL IDENTITY

VISUAL IDENTITY

To create a cohesive and impactful visual identity, we defined a graphic charter that reflects the values and goals of our project. We selected a harmonious color palette, appropriate typography, and graphic elements that enhance the user experience. Every visual choice was made to ensure a modern, accessible, and engaging aesthetic. This visual identity allowed us to ensure consistency across all platforms while facilitating the understanding and adoption of our product by users.

MOCK UP

MOCK UP

test

test

User Testing

User Testing

Hypothesis and Metrics:

👉 The app helps users arrive at their appointments more regularly while reducing their stress levels.

To verify this hypothesis, we defined several performance indicators:

📍 The number of app openings per trip.
📍 The average difference between arrival time and scheduled time.
📍 Responses to a post-experience survey to assess user feelings.

Test Procedure:

We formed groups, each representing a specific user profile:

👉 Group A: Residents of central Paris, exclusively using public transport.
👉 Group B: Suburban residents, combining public transport and alternative mobility (bikes, walking, cars).
👉 Group C: People with disabilities who need specific accessibility options.

Test Scenario:

📅 The three groups performed the test on the same day, from different starting points and with varying travel conditions.
📱 The day before, each participant received a lab phone to familiarize themselves with the app and customize settings according to their needs.
🚆 During their journey, they were able to use the app to adjust their route in case of unforeseen circumstances.

Accessibility and Adaptation:

We paid special attention to the needs of people with disabilities by integrating several features:

🔊 Voice assistance to guide the user throughout their experience.
⏰ Customizable sound and/or vibration alarm according to preferences.
♿ Information on transport accessibility to reduce stress related to poorly adapted infrastructure.

Evaluation and Analysis of Results:

At the end of the test, we collected various data to analyze the impact of the app:

📊 User Behavior

  • Number of app openings.

  • Verification of information via other competing apps.

⏳ Performance

  • Comparison between scheduled and actual arrival times.

📝 Post-experience Survey

We asked participants questions to gather subjective impressions:

💬 How do you feel right now?
💬 Did you experience stress during your journey?

Future developments

Future developments

For the future, we plan to enrich the user experience by integrating customizable avatars that can be displayed live on the map based on individual preferences. We also want to develop a family mode, allowing parents to manage their children's transport scenarios for added safety and fluidity. Finally, we are considering integrating surveys directly within the app to gather user feedback on their experience and continuously improve Zengo based on their real needs.

More Projects…

Want to get in touch ?

It would be a pleasure to connect with you.

Contact me

Want to get in touch ?

It would be a pleasure to connect with you.

Contact me

Want to get in touch ?

It would be a pleasure to connect with you.

Contact me

© Copyright Axelle Bally, 2025

All rights reserved.

© Copyright Axelle Bally, 2025

All rights reserved.

© Copyright Axelle Bally, 2025

All rights reserved.